
Development Report
To access this screen:
-
Activate the Survey Reports ribbon and select Development.
-
Run the command "survey-development-report"
-
Use the quick keys 'sdr'
The Development Report tool is used to calculate underground extraction volumes representing a time period. This is calculated both as the increase in underground void (say, along a drive or decline) and the difference between the void at the current and previous survey. Typically, it is used for end-of-month actual results.
Note: Development design string data should contain expected attributes, expected by the development report generator. If mandatory fields cannot be found, the Attribute Mapping dialog will be displayed, allowing you to map existing attributes to mandatory fields required later on. There are also optional fields that can be mapped, which can also be used in downstream reporting.
It can also be used to determine adherence to an underground design plan by comparing the extracted volumes with design data, typically a drive outline with a centerline.
Loaded development data with assigned drives
This facility supports underground survey scenarios.
Note: This tool supports batch processing: use Add to Batch to schedule processing at a later date, using the Run Batch task.
This report calculates void volume differences between two underground survey wireframes, and generates the following results/data;
- A volume representing the difference between the previous/current survey data from a given time period.
- A visual comparison of design and actual extraction data
- A results table containing volume actual vs. planned differences, advance distance, volume % discrepancy and so on.
A Development report would commonly be used to calculate the amount mined in a given time period (compared to contracted/expected rates).
All reports are performed within the context of a decline, area and level. These are selected at the top of the panel.
Survey data is typically from cavity monitoring systems (Lidar etc.) As with all Survey report inputs, data is added to the database first, and assigned to a particular data type (scan points, scan solids, design solids, design strings etc.). To generate a Development report, at least one previous surveyed solid and one current surveyed solid must existing within the database. It is the difference between these 3D shapes that is used to calculate extracted tonnage, face advance distance and other results.
Note: You can add surface data for a given time period to the current database using the Add to Database utility.
Optionally you can specify a design string file representing planned development. This can be used to assess compliance to the plan.
Report Output File Naming Convention
Output files from Studio Survey's reporting processes follow the same file naming convention. This is adopted to make files more easily recognizable outside of Studio Survey, and to make searching for them easier.
The following conventions are used
for reports:
Open pit
scenarios:
Report_<pit>_<area>_<rom>_<date>.xlsx
For example:
Report_Pit_1_Area_1_ROM_1_2020-03-23.xlsx
The following conventions are used for output data:
Open pit scenarios:
<data type>_<pit>_<area>_<rom>_<date>.dm
For example:
NaturalSurface_Pit_1_Area_1_2020-03-24_tr.dm
EOM Development Report Outputs
When you have defined the surfaces you wish to use during reporting of end-of-month results, click Calculate to generate the corresponding volume data. This data will be used to generate an end-of-month as-mined volume report.
Report generation can include the following items, as determined by your :
- A spreadsheet containing volume and face advance distance results. For each distinct extraction volume, results are reported representing the extraction volume between two survey dates.
- An Enhanced Metafile (.emf) image or, if a PDF driver is available,
a PDF file that is generated by Studio Survey in conjunction with
a plot file template, for example:
- Extraction volumes are generated representing the difference
between the current and previous survey information. One or more
solids can be produced, but they will be contained within a single
file (called "DriveSolids_tr/pt.dm"), e.g.:
- A string object containing a base outline for each calculated extraction volume(s) (DriveOutlines.dm)
- A string object containing extraction volume centerline(s) data (DriveCenterlines.dm)
- A Datamine table containing the results of volume assessment. The data in this file will be exported to Excel when the results are published.
Using the Reporting Date Calendar
When you select a date for reporting, the calendar tool can be used to see previous report date(s). These are highlighted in red, e.g.:
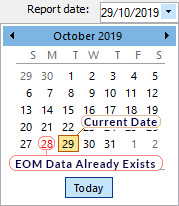
You can regenerate EOM data for any date, including dates for which EOM
output already exists but, in this scenario, you will need to confirm
if you wish to overwrite existing data.
Previewing and Loading Report Data
EOM reporting panels offer functions to preview both your report input surfaces/strings and your output volumes and reports/tables.

- Preview data: available for all report inputs represented by 3D data.
- Load data: available for all report inputs represented by 3D data, including output data.
If results data is previewed, up to three separate displays will be created:
- A PDF or .emf report: this is generated based on the current Plot Template that is associated with your project. Only displayed if it is possible to generate an output report in this format. Not seeing a PDF or .emf report? Check to see if your report has an associated plot template, using the Database Settings screen.
- Wireframe Volume: this represents the cut & fill solids created by your reporting task. This is shown in Datamine's Table Previewer application. Only displayed if it is possible to construct a 3-dimensional volume from the input data of your report.
- A Report Table: this table, in Datamine format, contains the volume assessment of your cut & fill volumes for the selected report. If it is not possible to construct a 3-dimensional volume, a table (nor any other output) will be displayed.
Configure a Development Report
-
Choose the Current Decline that is relevant to your report.
This is the decline associated with the current underground survey project is set using the Database Settings screen. You can either pick an existing decline using the drop-down list or access the settings dialog to modify the pits of the current database.
-
Choose the Current Area.
This is the underground area for the current report. This can be changed using the Database Settings screen, accessible via the browse button. You can either pick an existing area using the drop-down list or access the settings dialog to modify the areas of the current database.
-
Choose the Current Level.
As above, you can edit the levels of your current database using the Database Settings screen.
-
Choose the Current Stope.
This is the stope that represents the void volume you wish to calculate and report against. using the Declines panel of the Database Settings screen.
-
Select the Surveyor for the current report. Surveyor names are configured using the Survey Database Settings task. The Surveyor is displayed in the output end-of-month results, and will appear in the generated spreadsheet report once published.
-
Choose the Report Date. This is the date to be associated with filing the report. By default, this will be the current date. This information is stored in the output wireframe triangles file generated by the reporting process (according to cut and fill calculations), and will be shown in the accompanying published spreadsheet.
Note: You can generate multiple reports on the same day if you need to; each report will be labelled according to the time it was generated.
-
Choose a Natural Pit Surface: this drop-down list contains all previously added natural surfaces wireframe data. Select the item representing the natural/unmined surface for your selected pit and area. This will be used to calculate a to-date pit volume for the Pit Actual report.
If a surface is selected, two additional volumes are generated:
-
The volume between the natural and current surface
-
The volume between the natural and previous surface
Alternatively, select <none> to only create a cut and fill wireframe for the current and previous surveyed pit surfaces.
-
-
Choose a Surveyed Solid (current).
Typically, this will be scan data that has been added to the Survey Database in association with a survey date (added to the database as a Development Scan Solids type). This date is then available for selection here. This date represents the as-built surface for the selected date. It will be used to determine the extraction volume for the survey period by comparing it to the Surveyed Solid (previous) (see below).
-
Choose a Surveyed Solid (previous).
Select a surface (added to the database as a Development Scan Solids type) that corresponds to the date from which you wish to calculate an underground extraction volume and related results. Commonly, this will be the previous survey period end, but can be a surface representing any development period. This surface will be used to calculate the extraction volume between the selected date and the date of the Surveyed Solid (current) (see above).
-
Choose a Development Design String: an underground design string, commonly containing distinct planned drive centerlines (and possibly outlines). This data must include a DRIVE attribute as each drive within the file must be associated with an extraction volume in order to prepare the final report.
-
Define your Calculation Options to minimize the occurrence of unwanted trivial data fragments during cut and fill calculations:
-
Remove solids with volume below: by default, all cut and fill volumes that represent the difference between the specified surfaces (optionally constrained by a boundary) will contribute to the output EOM report. You can change this number to remove trivial fragments below a specified volume, with higher values leading to potentially greater volume removal where multiple small volumes are output.
-
Trim solids with thickness below: reduce the number of thin data fragments result from near-coincident surfaces by increasing this value. Higher values will tend to increase the amount of data removed from the output cut and fill solids and resulting report.
-
Decimate input surfaces to limit triangles to: ground data can be represented by very dense wireframe data, and this can lead to increased cut and fill calculation times. Enabled by default, input surfaces will be pre-decimated to reduce their data density and commit less dense/simplified data into the EOM volume calculation routine. This can increase the performance of the EOM reporting tool at the sacrifice of input surface detail.
-
-
Specify a Generated centerline adjustment (%).
This controls the way an extraction volume centerline is generated. In effect, it determines the % along the centerline deviations are permitted to occur to accommodate volume end shapes. For more granular control of centerline positions, you can use the Centerlines control group (see below).
-
Optionally, Use a fixed plot scale.
-
If checked, you can enter a custom scaling ratio in the activated field. The output PDF report will honour the custom scale, and if any Plot title boxes include a scale report, it is automatically adjusted to show the custom value used.
-
If unchecked, a scale is automatically calculated based on the output EOM data and Plot projection dimensions.
-
-
To generate evaluation results as part of your report, one option is to specify a block model:
-
Enable Use block model for reporting.
-
Use the "..." button to display the Block Model Options popup.
-
Fill out the fields on the Block Model Options screen and click OK.
Alternatively, instead of deriving a density from the block model database for purpose of tonnes/grades reporting, you can specify a default Density instead.
Note: You can either choose to generate evaluation results using a block model or a default density, not both.
-
-
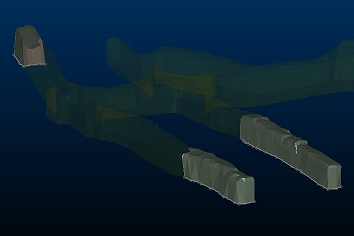
Generate your Solids.
Studio Survey analyses your surveyed surface data and will attempt to associate obvious elements of an underground layout with a corresponding drive description. In some cases, it may not be straightforward to calculate the point at which one volume finishes and another starts (this could be the case if a drive finger is being excavated from a decline at an oblique angle, for example).
The first step to producing a practical report is to generate the solids representing the difference between the two survey dates, and then associate each element with a drive description (as derived from the DRIVE attribute in the Development Design String). Automatic solid generation and mapping is done using the Generate solids button.
Once solids are generated, you can check to see if all distinct excavation volumes have been mapped to a drive label. In cases where this isn't possible (because no single part of the design string for the drive passes through the output difference volume), you will need to map drives yourself, using the Assign Drives...tool (see below).
-
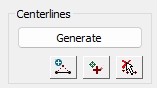
Choose your Centerlines options.
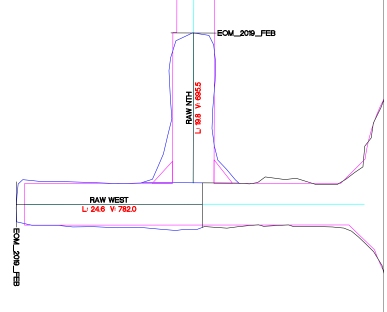
Face advance distance calculations require a centerline to be calculated for each of the generated difference volumes. Survey will generally do a good job of establishing a centerline position, but in some cases, such as where an output volume has multiple lines of symmetry, you may need to make adjustments. The first step is to Generate the centerlines automatically. Consider the example, below, where the automatically generated centerline deviates from an intuitively-sensible path towards the right, diverting upwards.
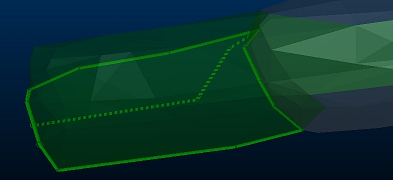
In this case, you can either adjust the Generated Centerline Adjustment (%) figure and recalculate to get a better outcome, or just edit the centerline yourself, using the collection of string adjustment tools below:
All centerlines should be reviewed prior to generating a report to avoid unexpectedly long or short face advance distance calculations.
-
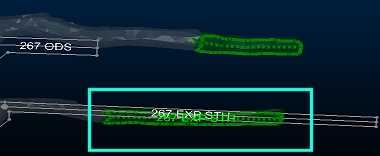
Use Assign Drives tools to pick generated excavation volumes and assign them to a drive represented by a DRIVE attribute value on the Development Design String.
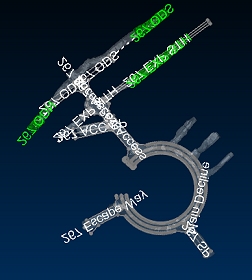
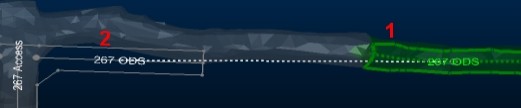
This tool should be used when automatic drive assignment hasn't been possible. This can occur if a generated volume doesn't intersect any design drive string element. In these situations, you will need to use the Assign Drives command to alternately pick a volume and drive string location. Consider the example below, where one drive has been automatically assigned (in the cyan rectangle) whilst the upper volume could not be logically assigned to a drive of the design string:
You can recognize a mapped volume by a the dashed line that joins it to a drive string label. Zooming in on the lower volume, shown above, makes this more obvious:
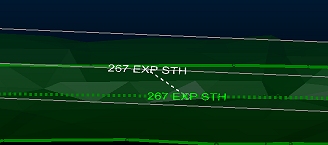
To assign the upper drive, you would run the Assign Drives command, then pick the volume, then the corresponding design string drive label, for example:
When all volumes have been assigned, you can create a report (see below).
-
Use Create Report to generate a report that includes the elements specified on the Database Settings screen (for the Development Report section). You can view the output data using the tools in the Results section (see below).
-
Review your Results.
Results of each report run are listed according to the time they were generated. The current list of reports represents the reports created on the current Report date.
You can preview the results of the report (this can display a variety of things, depending on your current Database Settings(Preview options), for example, you may be able to show a Datamine table, a corresponding PDF report, based on the current report template) and/or other options. Each report can be set up independently with regards to what data is shown when you preview results.
You can also load the results of the excavation calculation. This button is only enabled if the selected item contains 3D data (i.e. data generation has been successful).
Related topics and activities